Excel Pivot Table Mastery: A Comprehensive Guide to Creating Pivot Tables in Excel
Introduction: In the realm of data analysis and reporting, the ability to summarize, analyze, and visualize large datasets efficiently is essential for making informed decisions and deriving actionable insights. Microsoft Excel’s pivot tables offer a powerful toolset for transforming raw data into meaningful summaries and interactive reports, enabling users to explore data dynamically and uncover valuable insights with ease. In this comprehensive guide, we’ll delve into the intricacies of creating pivot tables in Excel, covering everything from basic pivot table creation to advanced techniques for customization and optimization, empowering you to harness the full potential of pivot tables for your data analysis needs.
Section 1: Understanding Pivot Tables in Excel
1.1 What are Pivot Tables and Why are They Important? 1.2 Benefits of Using Pivot Tables for Data Analysis 1.3 Types of Data Suitable for Pivot Table Analysis
Section 2: Getting Started with Pivot Tables
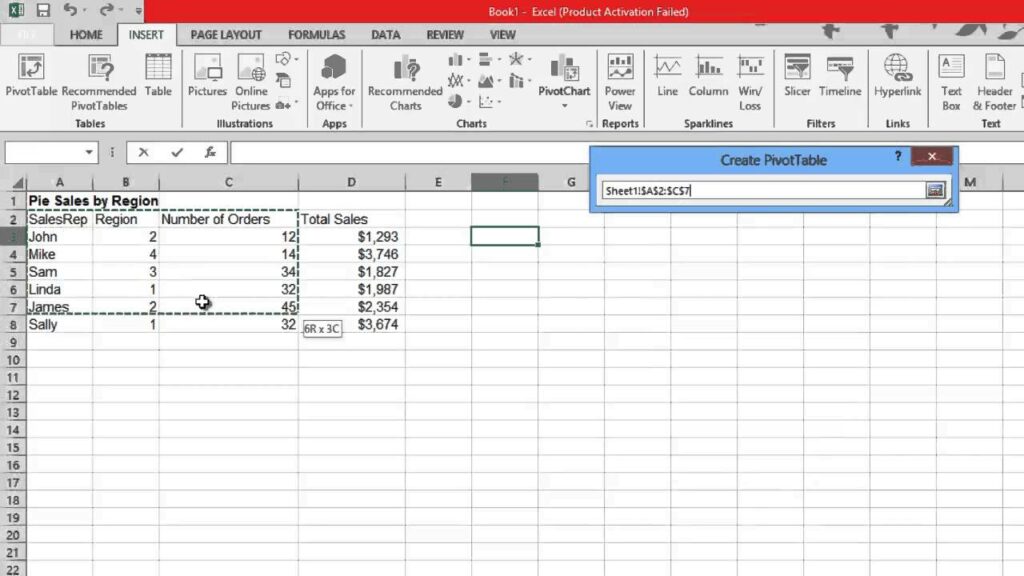
2.1 Accessing the PivotTable Command in Excel 2.2 Selecting the Data Range for Pivot Table Creation 2.3 Understanding PivotTable Fields: Rows, Columns, Values, Filters
Section 3: Basic Pivot Table Creation
3.1 Creating a Pivot Table from Scratch 3.2 Using Recommended PivotTables for Quick Analysis 3.3 Customizing Pivot Table Layout and Structure
Section 4: Pivot Table Fields and Areas
4.1 Adding Fields to Rows and Columns 4.2 Inserting Fields into the Values Area: Sum, Count, Average, etc. 4.3 Applying Filters to Pivot Tables for Data Subsetting 4.4 Customizing Pivot Table Field Settings: Sorting, Filtering, Subtotals
Section 5: Grouping and Ungrouping Data in Pivot Tables
5.1 Grouping Dates: Days, Months, Quarters, Years 5.2 Grouping Numeric Data: Ranges, Intervals 5.3 Ungrouping Data for Detailed Analysis 5.4 Managing Grouped Data in Pivot Tables
Section 6: Calculated Fields and Items
6.1 Creating Calculated Fields: Sum, Average, Percentage, etc. 6.2 Using Calculated Items for Custom Calculations 6.3 Editing and Deleting Calculated Fields and Items 6.4 Incorporating Formulas and Functions in Calculated Fields
Section 7: Pivot Table Layout and Formatting
7.1 Adjusting Pivot Table Layout: Row and Column Width, Cell Formatting 7.2 Formatting Pivot Table Values: Number Formats, Font Styles, Colors 7.3 Applying Conditional Formatting to Pivot Tables 7.4 Customizing Pivot Table Styles and Themes
Section 8: Pivot Table Analysis Techniques
8.1 Filtering Pivot Table Data: Slicers, Timeline Filters, Report Filters 8.2 Sorting Pivot Table Data: Ascending, Descending 8.3 Drilling Down and Drilling Up in Pivot Tables 8.4 Refreshing Pivot Table Data: Updating Source Data, Rebuilding Pivot Tables
Section 9: Advanced Pivot Table Techniques
9.1 Creating Multiple Pivot Tables from the Same Data Source 9.2 Using External Data Sources: SQL Queries, OLAP Cubes, etc. 9.3 Leveraging Power Pivot for Enhanced Data Analysis 9.4 Incorporating Pivot Charts for Visual Analysis
Section 10: Tips and Best Practices for Effective Pivot Table Usage
10.1 Keep Source Data Clean and Consistent Before Creating Pivot Tables 10.2 Use Descriptive Field Names and Labels for Clarity 10.3 Experiment with Pivot Table Layouts and Configurations 10.4 Document Pivot Table Settings and Procedures for Future Reference
Section 11: Troubleshooting Common Pivot Table Issues
11.1 Dealing with Pivot Table Errors: Missing Data, Incorrect Calculations 11.2 Handling Performance Issues with Large Datasets 11.3 Resolving Layout and Formatting Problems 11.4 Addressing Compatibility Issues with Older Excel Versions
Section 12: Collaborative Pivot Table Analysis
12.1 Sharing Pivot Tables with Colleagues and Collaborators 12.2 Co-Authoring and Editing Pivot Tables Simultaneously 12.3 Using Comments and Annotations for Feedback 12.4 Leveraging Version History and Revision Tracking
Section 13: Learning Resources and Further Exploration
13.1 Excel Pivot Table Tutorials and Courses 13.2 Online Communities and Forums for Pivot Table Enthusiasts 13.3 Advanced Books and Publications on Pivot Table Analysis 13.4 Continuous Learning and Skill Development in Pivot Table Mastery
Conclusion: Congratulations! You’ve now mastered the art of creating pivot tables in Excel. By following the techniques outlined in this guide and experimenting with different pivot table features and options, you’ll be able to transform your raw data into actionable insights and interactive reports with ease. Whether you’re analyzing sales data, summarizing financial reports, or exploring survey results, Excel pivot tables empower you to unlock the full potential of your data and make informed decisions with confidence. So, embrace the power of pivot tables in Excel and elevate your data analysis game to new heights of excellence.