Mastering Financial Analysis: A Comprehensive Guide on How to Calculate Average Growth Rate in Excel
Introduction:
In the realm of financial analysis, understanding and calculating growth rates are fundamental skills for evaluating business performance, investment opportunities, and economic trends. Microsoft Excel, a powerhouse in data analysis, provides a versatile platform for performing complex calculations with ease. In this comprehensive guide, we will delve into the intricacies of calculating average growth rates in Excel, exploring various methods, step-by-step procedures, and practical applications for harnessing this valuable tool in financial analysis.
Understanding Average Growth Rate:
Average growth rate is a metric used to quantify the average annual rate of growth or decline over a specific period. This measure is crucial for assessing trends, forecasting future performance, and making informed decisions based on historical data. Whether analyzing revenue, profits, or any other key performance indicators, calculating average growth rate in Excel empowers users to gain valuable insights into the trajectory of a given metric.
Methods for Calculating Average Growth Rate in Excel:
- Straight-Line or CAGR (Compound Annual Growth Rate) Method:
- Straight-Line Method: The straight-line method calculates average growth as the total change over the total number of periods. The formula is as follows: Average Growth Rate=Ending Value−Beginning ValueNumber of Periods
- CAGR Method: The Compound Annual Growth Rate provides a smoothed representation of growth, assuming a steady, compounded rate. The formula is: CAGR=(Ending ValueBeginning Value)1Number of Periods−1
- Using Excel Functions:
- YEAR-OVER-YEAR (YOY) Growth: The YOY growth is a simple method using Excel functions. If your data is organized by years, the formula is: YOY Growth=Current Year Value−Prior Year ValuePrior Year Value
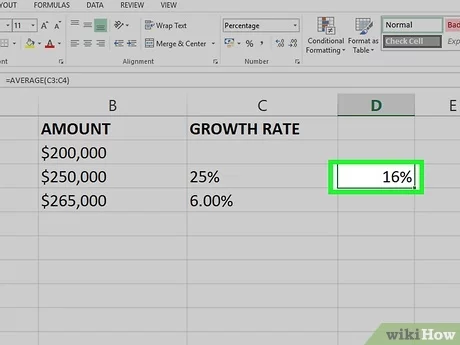
- AVERAGE Function: Another method involves using the AVERAGE function for calculating the average of annual growth rates over multiple periods.
Step-by-Step Guide to Calculate Average Growth Rate in Excel:
- Organize Data: Ensure that your data is structured appropriately in Excel, with columns for relevant metrics and corresponding time periods.
- Determine the Calculation Method: Choose the appropriate method based on the nature of your data and the insights you aim to derive (Straight-Line, CAGR, YOY, or AVERAGE).
- Apply the Chosen Formula:
- Straight-Line or CAGR: Apply the selected formula using the relevant cells and referencing the appropriate data points.
- YOY Growth: Use the YOY growth formula for each relevant period, referencing the corresponding cells.
- AVERAGE Function: Utilize the AVERAGE function to calculate the average of the growth rates obtained.
- Format the Result: Format the cell containing the calculated average growth rate as a percentage to enhance readability.
Practical Applications:
- Financial Performance Analysis: Evaluate the average annual growth of financial metrics such as revenue, profits, or expenses to assess the overall performance of a business.
- Investment Decision-Making: Analyze the historical average growth rate of key performance indicators for potential investment opportunities, helping investors make informed decisions.
- Economic Trends: Calculate average growth rates for economic indicators to identify trends, assess the health of economies, and inform policy decisions.
- Sales Forecasting: Utilize average growth rates to forecast future sales, allowing businesses to plan and allocate resources effectively.
- Project Planning: Project managers can use growth rates to estimate project progress and set realistic expectations for stakeholders.
Common Challenges and Considerations:
- Data Quality: Ensure that the data used for calculations is accurate, complete, and free from errors to obtain reliable results.
- Time Period Consistency: Maintain consistency in the time periods used for calculations to ensure comparability and accuracy.
- Understanding the Context: Interpret the results in the context of the specific metric being analyzed and the industry or sector in which it operates.
- Sensitivity to Outliers: Be cautious of the impact of outliers on growth rate calculations, as extreme values can skew results.
- Regular Updates: Given the dynamic nature of business and financial data, regularly update calculations to reflect the most recent information.
Conclusion:
Mastering the art of calculating average growth rates in Excel is a valuable skill for professionals in finance, business, and economics. Whether assessing company performance, making investment decisions, or forecasting future trends, Excel provides a robust platform for conducting these analyses. By understanding the various methods, following a step-by-step guide, and considering practical applications, users can harness the power of Excel to derive meaningful insights and make informed decisions in the ever-evolving landscape of financial analysis.